Demographics
population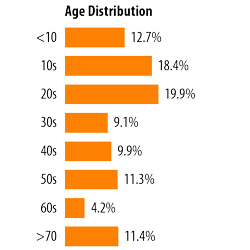
Male 2,840
Female 3,164
Total 6,004
No. of Households 2,004
Avg Household Size 2.61
Avg Family Size 3.08
Median Age 29.1
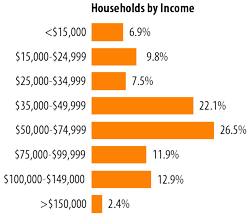
Median Household Income $53,750
Avg Household Income $61,691
Per Capita Income $20,768
Median Disposable Income $37,867
employment
 White Collar Jobs 2,792
Blue Collar Jobs 1,012
Service Jobs 933
Employed 4,798
Unemployed 3.7%
• Nearly 93% of Orange City’s population age 25+ have a high school diploma. 39% have a bachelor’s degree or higher. 18% have a graduate or professional degree.
• Orange City’s population average age is 29 years compared to Iowa average of 36 years.
• Sioux County recently scored as the SECOND LEAST economically stressed county in the United States.
state & county quickfacts
People QuickFacts |
Sioux County |
Iowa |
| Population, 2010 | 33,704 | 3,046,355 |
| Population, percent change, 2000 to 2010 | 6.70% | 4.10% |
| Population, 2000 | 31,589 | 2,926,324 |
| Persons under 5 years, percent, 2010 | 7.80% | 6.60% |
| Persons under 18 years, percent, 2010 | 26.80% | 23.90% |
| Persons 65 years and over, percent, 2010 | 14.30% | 14.90% |
| Female persons, percent, 2010 | 50.10% | 50.50% |
| White persons, percent, 2010 (a) | 93.30% | 91.30% |
| Black persons, percent, 2010 (a) | 0.40% | 2.90% |
| American Indian and Alaska Native persons, percent, 2010 (a) | 0.30% | 0.40% |
| Asian persons, percent, 2010 (a) | 0.80% | 1.70% |
| Native Hawaiian and Other Pacific Islander, percent, 2010 (a) | 0.00% | 0.10% |
| Persons reporting two or more races, percent, 2010 | 0.90% | 1.80% |
| Persons of Hispanic or Latino origin, percent, 2010 (b) | 8.90% | 5.00% |
| White persons not Hispanic, percent, 2010 | 89.30% | 88.70% |
| Living in same house 1 year & over, 2005-2009 | 88.00% | 83.40% |
| Foreign born persons, percent, 2005-2009 | 4.40% | 3.80% |
| Language other than English spoken at home, pct age 5+, 2005-2009 | 6.40% | 6.40% |
| High school graduates, percent of persons age 25+, 2005-2009 | 86.80% | 89.60% |
| Bachelor’s degree or higher, pct of persons age 25+, 2005-2009 | 21.60% | 24.20% |
| Veterans, 2005-2009 | 1,887 | 245,653 |
| Mean travel time to work (minutes), workers age 16+, 2005-2009 | 12.2 | 18.3 |
| Housing units, 2010 | 12,279 | 1,336,417 |
| Homeownership rate, 2005-2009 | 82.10% | 72.90% |
| Housing units in multi-unit structures, percent, 2005-2009 | 12.50% | 18.70% |
| Median value of owner-occupied housing units, 2005-2009 | $112,900 | $115,800 |
| Households, 2005-2009 | 11,211 | 1,215,970 |
| Persons per household, 2005-2009 | 2.66 | 2.36 |
| Per capita money income in past 12 months (2009 dollars) 2005-2009 | $21,156 | $25,060 |
| Median household income, 2009 | $50,978 | $48,065 |
| Persons below poverty level, percent, 2009 | 7.10% | 11.80% |
Business QuickFacts |
Sioux County |
Iowa |
| Private nonfarm establishments, 2009 | 1,205 | 80,971 |
| Private nonfarm employment, 2009 | 17,203 | 1,283,769 |
| Private nonfarm employment, percent change 2000-2009 | 14.60% | 1.50% |
| Nonemployer establishments, 2009 | 2,262 | 195,410 |
| Total number of firms, 2007 | 3,659 | 259,931 |
| Black-owned firms, percent, 2007 | F | 0.80% |
| American Indian and Alaska Native owned firms, percent, 2007 | F | 0.20% |
| Asian-owned firms, percent, 2007 | F | 1.10% |
| Native Hawaiian and Other Pacific Islander owned firms, percent, 2007 | F | 0.10% |
| Hispanic-owned firms, percent, 2007 | S | 0.90% |
| Women-owned firms, percent, 2007 | 18.30% | 25.50% |
| Manufacturers shipments, 2007 ($1000) | 1,152,404 | 97,592,051 |
| Merchant wholesaler sales, 2007 ($1000) | 753,139 | 41,068,338 |
| Retail sales, 2007 ($1000) | 394,422 | 39,234,649 |
| Retail sales per capita, 2007 | $12,319 | $13,172 |
| Accommodation and food services sales, 2007 ($1000) | 31,746 | 4,737,719 |
| Building permits, 2010 | 88 | 7,607 |
| Federal spending, 2009 | 199,406 | 28,948,525 |
Geography QuickFacts |
Sioux County |
Iowa |
| Land area in square miles, 2010 | 768.33 | 55,857.13 |
| Persons per square mile, 2010 | 43.9 | 54.5 |
| FIPS Code | 167 | 19 |
| Metropolitan or Micropolitan Statistical Area | None |